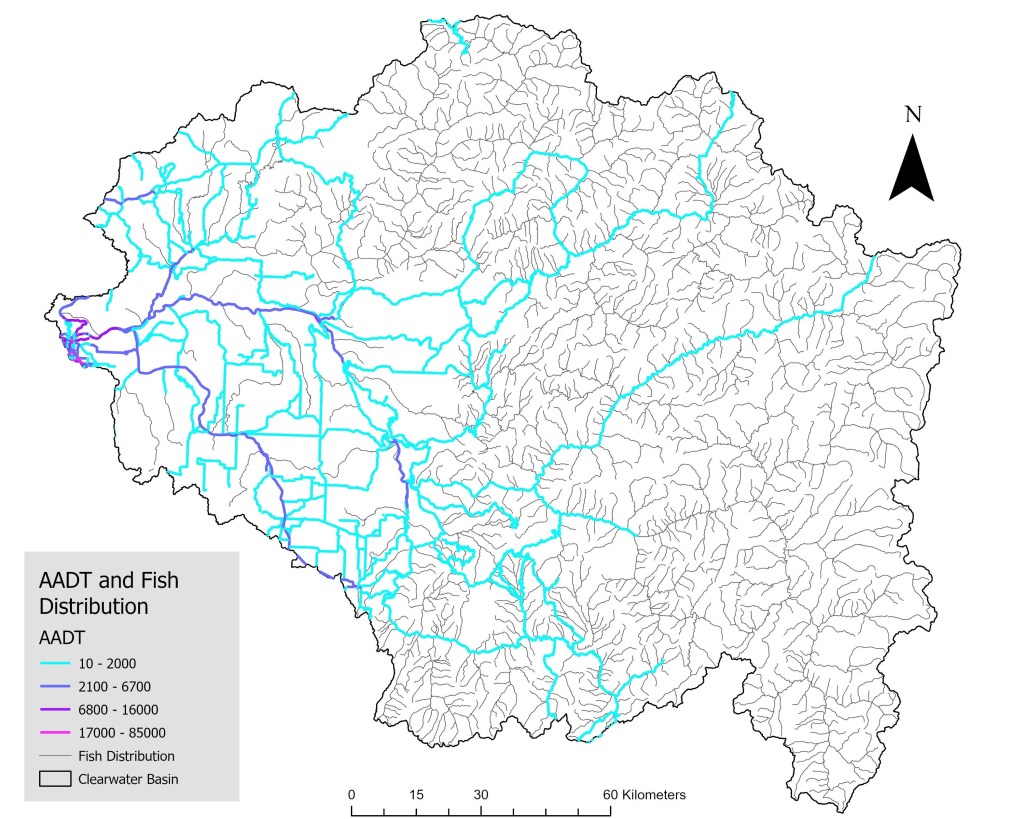
A map I created in ArcGIS to show different traffic volume intensities and fish distribution networks throughout the Clearwater Basin. Using data layers published through ArcGIS Online, I downloaded fish distribution data from IDFG, traffic data (average annual daily traffic) from Idaho Department of Transportation, and clipped these two layers to the Clearwater Basin layer I downloaded from USGS.

I created this map to show fish habitat that is within 200m from a primary road in the Clearwater Basin. I used the same fish distribution data from the map above and downloaded the primary road layer as a shapefile from TIGER/Line. After clipping these layers to the Clearwater Basin, I used the pairwise buffer tool on the road layer and used this as my buffer for the fish distribution layer.
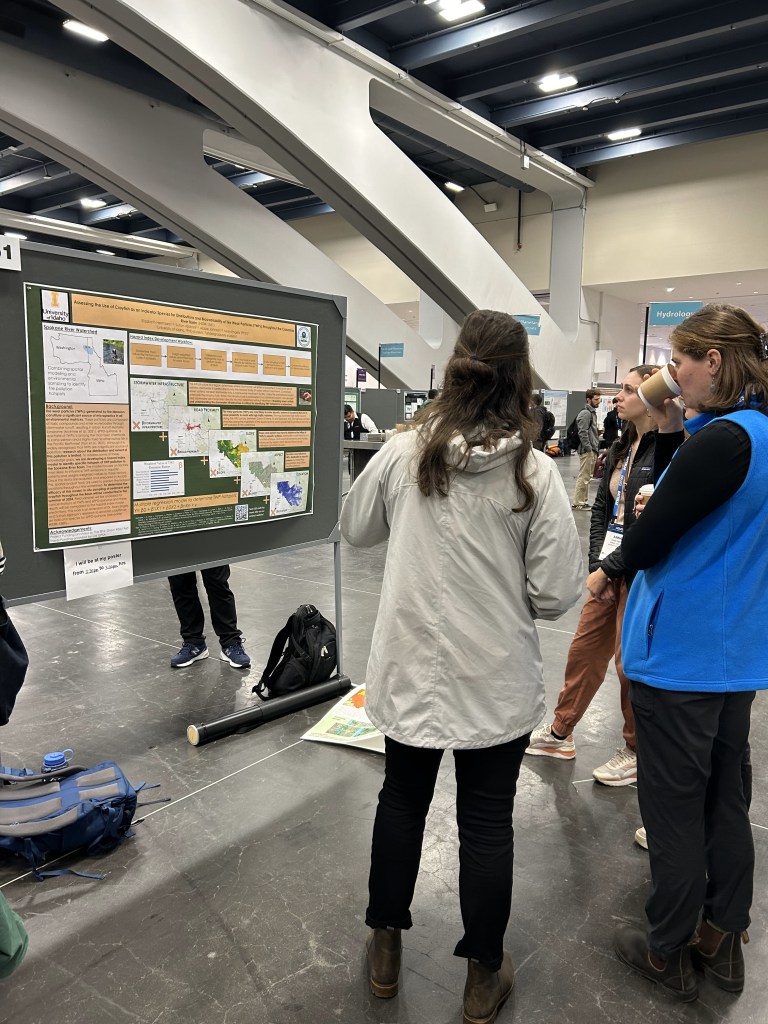
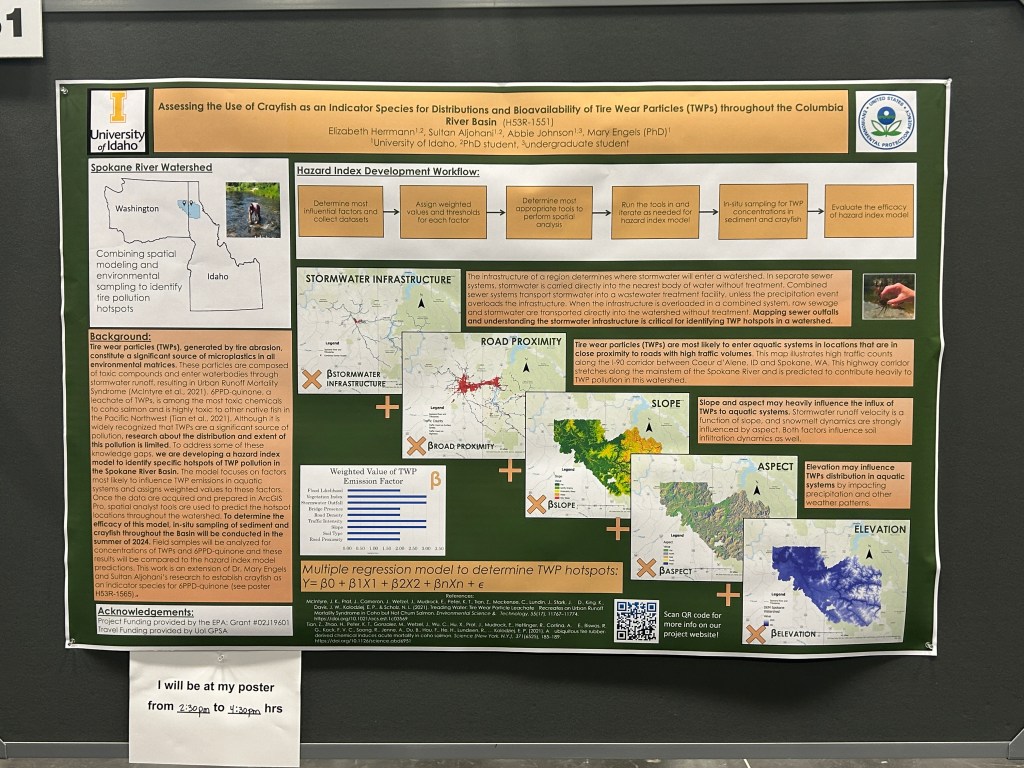
Photos of me presenting the poster I created for the 2023 Fall American Geophysical Union conference. The maps I created reflect a simplified approach for predicting hotspot tire pollution by overlaying predictor variables and factoring the weight of influence for each layer.
